 Blog
How to Do an ELISA: A Step-by-Step Guide for 2026
An ELISA is an antibody-based laboratory test that uses binding, washing, and an enzyme-generated signal to measure a target in a sample. Learning how to do an ELISA means learning how to protect the final concentration, not just how to produce color.
A plate has just developed a clear difference between pale and dark wells. The darker wells look convincing, but the important question is whether the standards, controls, sample dilutions, and timing support that difference.
By Multimod Labs.
Table of Contents
- What an ELISA Measures and Which Format to Choose
- Setting Up Plates, Reagents and Dilutions
- Step-by-Step ELISA Procedure With Modern Tools
- Controls and Matrix Checks That Make Results Trustworthy
- Reading Results and Fixing Weak, High or Uneven Signals
- Record Bench Observations as They Happen
What an ELISA Measures and Which Format to Choose
ELISA stands for enzyme-linked immunosorbent assay. Antibodies, proteins that recognize particular targets, hold or detect the substance being measured. An attached enzyme then converts an added reagent into a measurable signal.
In a conventional color-based ELISA, the plate reader measures absorbance, meaning how much light the liquid absorbs. The scientist compares that reading with a standard curve, a relationship built from samples containing known target concentrations. The Antibodies.com ELISA guide explains why standards, washing, appropriate dilution, and repeated measurements are essential to interpreting the signal.
ELISA formats compared
| Format | How the signal is made | Best when | Main limitation |
|---|---|---|---|
| Direct | A labeled primary antibody binds the target attached to the plate | Few steps and fast screening are priorities | Little signal amplification; each antibody must be labeled |
| Indirect | An unlabeled primary antibody binds first, followed by a labeled secondary antibody | Flexible detection of different antibodies is needed | The secondary antibody can bind unintended material and raise background |
| Sandwich | A capture antibody holds the target; a detection antibody binds another accessible site | Measuring proteins in complex samples | Requires a matched antibody pair; generally unsuitable for small molecules |
| Competitive | Sample target and a reference compete for limited antibody binding | Measuring small molecules with a single usable binding site | Signal decreases as target concentration increases |
A sandwich ELISA needs matched antibodies that recognize different accessible parts of the target without obstructing each other. Larger proteins can offer these separate binding sites; a small molecule generally can't. Choose the format by target size, available antibodies, and intended sample type, then confirm the choice against the kit or established method.
What a successful assay can reveal
ELISAs can measure antibodies, hormones, viral proteins, and other targets in serum, plasma, culture medium, or tissue extracts when the method supports that combination. Applications include research quantification, vaccine-response studies, and diagnostic screening with an appropriately validated assay. For the biological distinction between the target and the antibody that recognizes it, BacteriaFAQ.com's guide to understanding immune responses and vaccines provides useful background.
Eva Engvall and Peter Perlmann at Stockholm University published the first landmark ELISA paper in 1971, replacing radioactive detection with an enzyme-generated color signal, as described in this Clinical Chemistry historical account.
Practical rule: A correct quantitative run delivers a concentration supported by controls, not merely a dark well.
That concentration is useful only when the sample's surrounding material hasn't distorted the measurement. A poorly controlled assay can produce an impressive color and an unreliable answer.
Setting Up Plates, Reagents and Dilutions
Most preventable ELISA problems begin before sample loading. A mislabeled dilution or poorly mixed standard can survive every later step and still produce a tidy-looking plate.
Use a pre-run checklist that connects each preparation task to its purpose.
- Confirm the method. Check the kit instructions, supported sample types, required plate, and detection chemistry. A pre-coated plate may already have completed stages that a laboratory-developed assay requires.
- Check materials. Record reagent names, lot numbers, expiry dates, and preparation dates. Confirm that enough wash buffer and detection reagent are available before starting.
- Prepare temperatures deliberately. Bring reagents to the specified working temperature where the method requires it. Don't assume every reagent should warm on the bench.
- Make standards carefully. Prepare the specified dilution series from the known stock. Mix each dilution before transferring liquid into the next tube.
- Plan sample dilution. Choose initial dilutions before loading, and reserve enough sample for repeat testing.
- Finalize the plate map. Assign standards, controls, and samples to named wells before opening tubes.
Dilution changes the measurement
Dilution isn't just a way to make a sample easier to pipette. It places the target within the assay's usable measurement range and can reduce interference from other sample components.
For an unfamiliar sample, a preliminary run across several dilutions is more informative than committing the entire plate to a guess. The Antibodies.com sample protocol recommends measurements in duplicate or triplicate, meaning repeated wells from the same prepared sample, to reveal pipetting or well-to-well differences.
A plate map that can be checked
An illustrative 12-position planning strip could assign paired positions to a blank, low standard, middle standard, high standard, negative control, and positive control. That's a planning example, not a complete calibration scheme; the actual plate must include every standard and control required by the method.
Write sample names, dilution factors, and preparation details beside their assigned wells. The ELISA plate template offers a starting structure for recording those assignments.
Where the method permits, use peripheral reference wells to investigate whether outer wells behave differently. Don't automatically relocate all controls to the edge or discard outer wells without testing that layout.
Step-by-Step ELISA Procedure With Modern Tools
Every choice on the plate leaves evidence. A row can look uniform while uneven timing, carryover, a dried well, or a bubble changes what the reader measures. Work each stage so the recorded conditions can explain the final number.
ELISA workflow stages with typical values
| Stage | What happens | Typical value | What to record |
|---|---|---|---|
| Coat | Capture antibody or target binds the plastic | Kit or method sets coating concentration, buffer, time, and temperature | Concentration, buffer, time, temperature |
| Block | Unused plastic surface is covered | Method-specific blocker and duration | Blocker type and actual duration |
| Load samples and standards | Prepared samples and known standards enter assigned wells | Method-specific fill volume and replicate layout | Dilutions and actual well map |
| Incubate | Binding reactions develop | About 1 hour at room temperature in a Merck sandwich ELISA example | Start, finish, temperature |
| Wash | Unbound material is removed | Method-specific cycle count; kit instructions take precedence | Cycle count and washing method |
| Add detection reagent | Detection components bind and provide the enzyme label | Method-specific concentration and duration | Reagent lot and incubation |
| Develop color | Enzyme acts on the added substrate | Method-specific development window | Actual duration and temperature |
| Stop and read | Reaction is stopped where required and the plate is measured | Chemistry-specific wavelength and read window | Stop time, read time, settings |
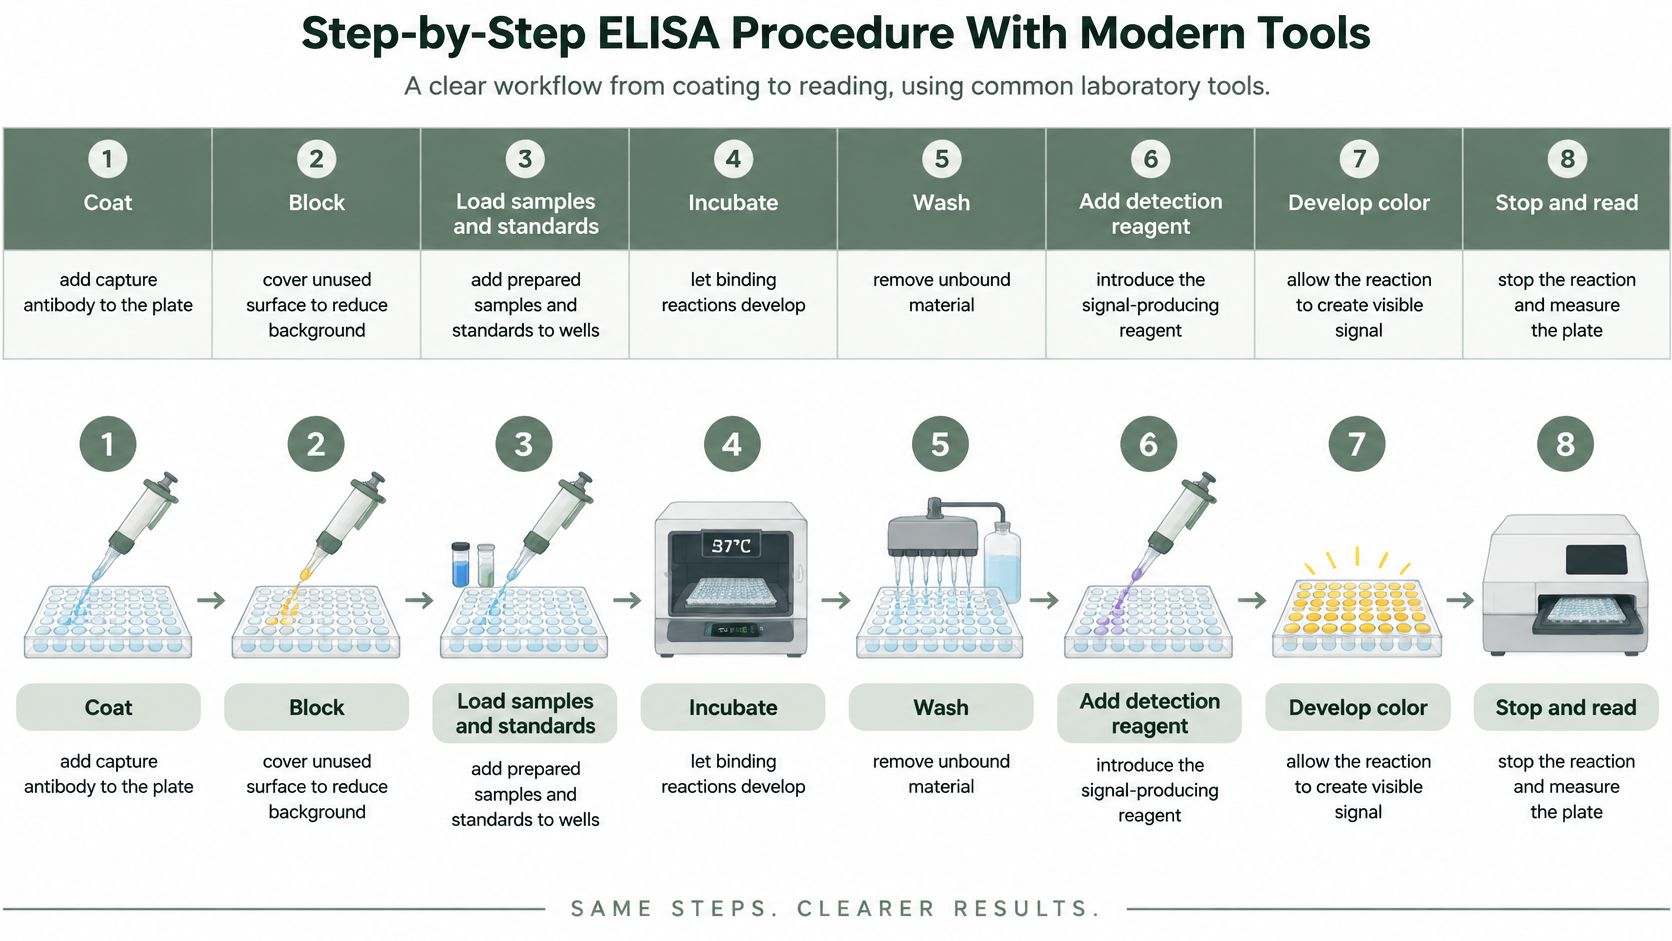
Treat the table as a route map for the workflow. A kit's validated instructions set the applicable volumes, wash counts, and incubation conditions.
The visual workflow separates the major stages, although washing also occurs between several binding steps.
Carry out the binding and detection steps
- Coat if required. Dilute capture antibody in the specified coating buffer, dispense it, and cover the plate. The cover helps prevent uneven evaporation that could leave wells with different starting conditions. Pre-coated kits may omit this operation.
- Wash and block. Apply the method's wash sequence, then add blocker to cover unused plastic. This leaves fewer exposed surfaces where later reagents could bind.
- Load standards and samples. Follow the plate map, change tips to prevent carryover, meaning material dragged from one well into another, and use a consistent loading order. Working from blank toward higher standards can help reduce contamination risk.
- Incubate, then wash. Cover the plate and record actual start and finish times. Remove unbound material while keeping wells from drying between operations.
- Add detection reagent. Follow the specified reagent sequence, incubation, and washes. Some systems require separate detection-antibody and enzyme-label additions, with the enzyme later producing the measured signal.
- Develop the signal. Add substrate, the reagent the enzyme converts into color, in a consistent order. Start the timer and record unusual color or cloudiness.
- Stop and measure. Add stop solution where required, using the specified sequence, then read within the method's allowed window. Check for bubbles before measurement.
Modern equipment improves consistency across wells
A calibrated multichannel pipette helps deliver matching volumes across wells. An automated washer can standardize washing, while its channels and liquid-removal settings still need checking. Plate seals reduce evaporation. Reader software can fit curved calibration relationships when standard readings do not rise along a straight line.
These tools make repeated handling more uniform. The method and its controls still decide whether that uniformity produces a valid result.
Newer formats also include microfluidic fluorescent ELISA, which uses small fluid channels and fluorescence to generate signal. A 2024 Scientific Reports study demonstrates that approach. The study does not establish a universal replacement for a validated plate assay.
Plan instrument access around the whole workflow. A 2024 MethodsX study reported approximately 5 hours and 30 minutes, excluding overnight incubation, with about 1 hour and 20 minutes of hands-on work for its particular procedure.
For teams converting a method into a usable bench checklist, Tutorial AI's guide to procedure writing for technical documentation teams can help organize actions and decision points. Keep expected instructions separate from actual observations.
The accompanying video provides another view of ELISA handling.
Controls and Matrix Checks That Make Results Trustworthy
A plate can show a tidy gradient of color and still produce a wrong number. More antibody, a longer incubation, or a more concentrated sample can all raise the reading by increasing unwanted binding rather than by measuring more target. The controls exist to prove where each part of the signal comes from.
Each control works like a separate witness: it can testify about one kind of failure and stays silent about the others. The sample matrix, meaning everything surrounding the target such as serum proteins or the contents of broken-open cells, is a frequent source of quiet failure because it can push the apparent result higher or lower without leaving any visible mark on the plate. When a result needs investigating, the Sigma-Aldrich ELISA troubleshooting guide covers checking sample dilution, washing, reagent handling, and detection conditions.
Controls and what each one catches
| Control | What it shows | What it catches |
|---|---|---|
| Blank | Signal from assay reagents without target | Reagent contamination or unwanted assay background |
| Negative control | Behavior of a sample matrix without the target | Unwanted binding associated with the matrix |
| Positive control | Response from a known positive sample within the usable range | Failed reagents or incorrect detection conditions |
| Standard curve | Readings across known concentrations | Unreliable calibration or a poorly defined measurement range |
| Dilutional linearity | Agreement after correcting results from different sample dilutions | Interference that changes with dilution |
| Spike and recovery | Measurement after a known amount of target is added | Target being hidden or overestimated by the sample |
| Inter-plate reference | Response from the same material across plates | Changes between plates or runs |
The blank confirms that the assay reagents produce no signal on their own. The negative control confirms that the sample matrix stays quiet in the absence of target. Each clears a different suspect, so both need to pass before a sample reading means anything.
A positive control confirms that the complete detection chain works, from capture through the final color reaction. Keep its concentration inside the usable range, because a saturated positive can pass even when assay performance has slipped.
Test the sample, not just the reagents
Dilutional linearity asks whether the dilution series planned during setup works on this sample. Correct each dilution result by its factor and check that the corrected concentrations agree. A steady drift in the corrected values points to interference that weakens as the matrix is diluted out.
Spike and recovery asks whether the assay can find a known amount of target placed inside the actual sample. Compare the spiked sample with an otherwise matched unspiked sample, account for any volume change, and judge the recovered amount against the method's predefined acceptance criteria.
Where feasible, prepare a matrix-matched standard curve by making standards in a liquid as close as possible to the sample type. Standards and unknowns then face similar conditions, so agreement between them means more.
A plate that looks clean is evidence the pipetting went smoothly. The controls are the evidence the measurement is true.
A common early mistake is to average the sample wells first and glance at the controls afterward. Read the controls first, because they decide whether the sample numbers deserve trust at all. If the standards fail, look at preparation, reagents, washing, and reader settings. If the standards pass but linearity or recovery fails, the matrix is the prime suspect. If every check passes and the sample still sits below the usable range, report that limitation plainly rather than inventing a precise low number.
Reading Results and Fixing Weak, High or Uneven Signals
A plate can look perfectly clean on the bench and still produce numbers that mislead. The reader reports how much light each well absorbs; every choice applied afterward, from the curve model to the accepted dilution, either protects the final concentration table or corrupts it. Save the raw readings and the plate map before correcting or fitting anything, because those originals are the evidence the rest of the analysis stands on.
Turn readings into concentrations
- Inspect blanks and standards. In a conventional noncompetitive assay, readings should rise steadily as standard concentration increases; in a competitive assay, the direction reverses. Any unexpected change in direction needs investigation before fitting begins.
- Fit the specified model. A four-parameter logistic curve is an S-shaped mathematical fit to the standards, while a five-parameter model accommodates an uneven S shape. Use the model the assay validates.
- Check repeated wells before averaging. Investigate disagreement using the method's acceptance rules. Calculate the concentration represented by each valid reading, then multiply by its dilution factor to recover the original-sample concentration.
- Flag results outside the usable range. Extending the curve beyond its validated limits assigns a precision the data never earned. Repeat at an appropriate dilution or report the applicable measurement limitation.
The standard curve analysis tool fits standards, back-calculates sample concentrations, and shows recovery and fit warnings, which helps when checking a fitted relationship. The scientist still verifies the inputs, dilution factors, and acceptance decisions.
Symptoms, likely causes and first fixes
| Symptom | Likely cause | First fix | What to record |
|---|---|---|---|
| High background across the plate | Insufficient washing or inadequate blocking | Check washing performance and blocking duration; test changes in a repeat run | Wash count, residual liquid, blocking time |
| Weak or absent standard signal | Inactive reagent or incorrect reader setting | Check reagent condition and required wavelength | Lot numbers and reader settings |
| Strong signal but implausible concentration | Matrix interference or result outside the usable range | Test dilutional linearity and spike recovery | Dilutions and recovery results |
| Outer wells differ from central wells | Evaporation or uneven temperature | Check sealing and test reference material across plate positions | Positions and seal condition |
| Repeated wells disagree | Pipetting error, bubbles, or local washing problems | Inspect wells and check pipette performance | Pipette, affected wells, operator |
| Uneven color after stopping | Incomplete mixing | Gently mix as permitted by the method; read within its window | Observation time and action taken |
A symptom on the plate points to where to look first; only a repeat run under the validated conditions confirms the cause. Once washing or blocking changes after seeing an endpoint, that plate no longer represents the validated run, and its numbers need a fresh repeat to count.
The G-Biosciences ELISA protocol specifies 15–30 minutes at 37 °C for its substrate step and immediate reading at 450 nm after stopping. It also warns that incomplete liquid removal can impair performance and recommends gently tapping the plate if the stopped color isn't uniform.
Timing and mixing belong to the same evidence chain. A reread that looks acceptable still comes from a plate that already showed a problem, so the choice between the two measurements should follow the method's predefined rules.
Record Bench Observations as They Happen
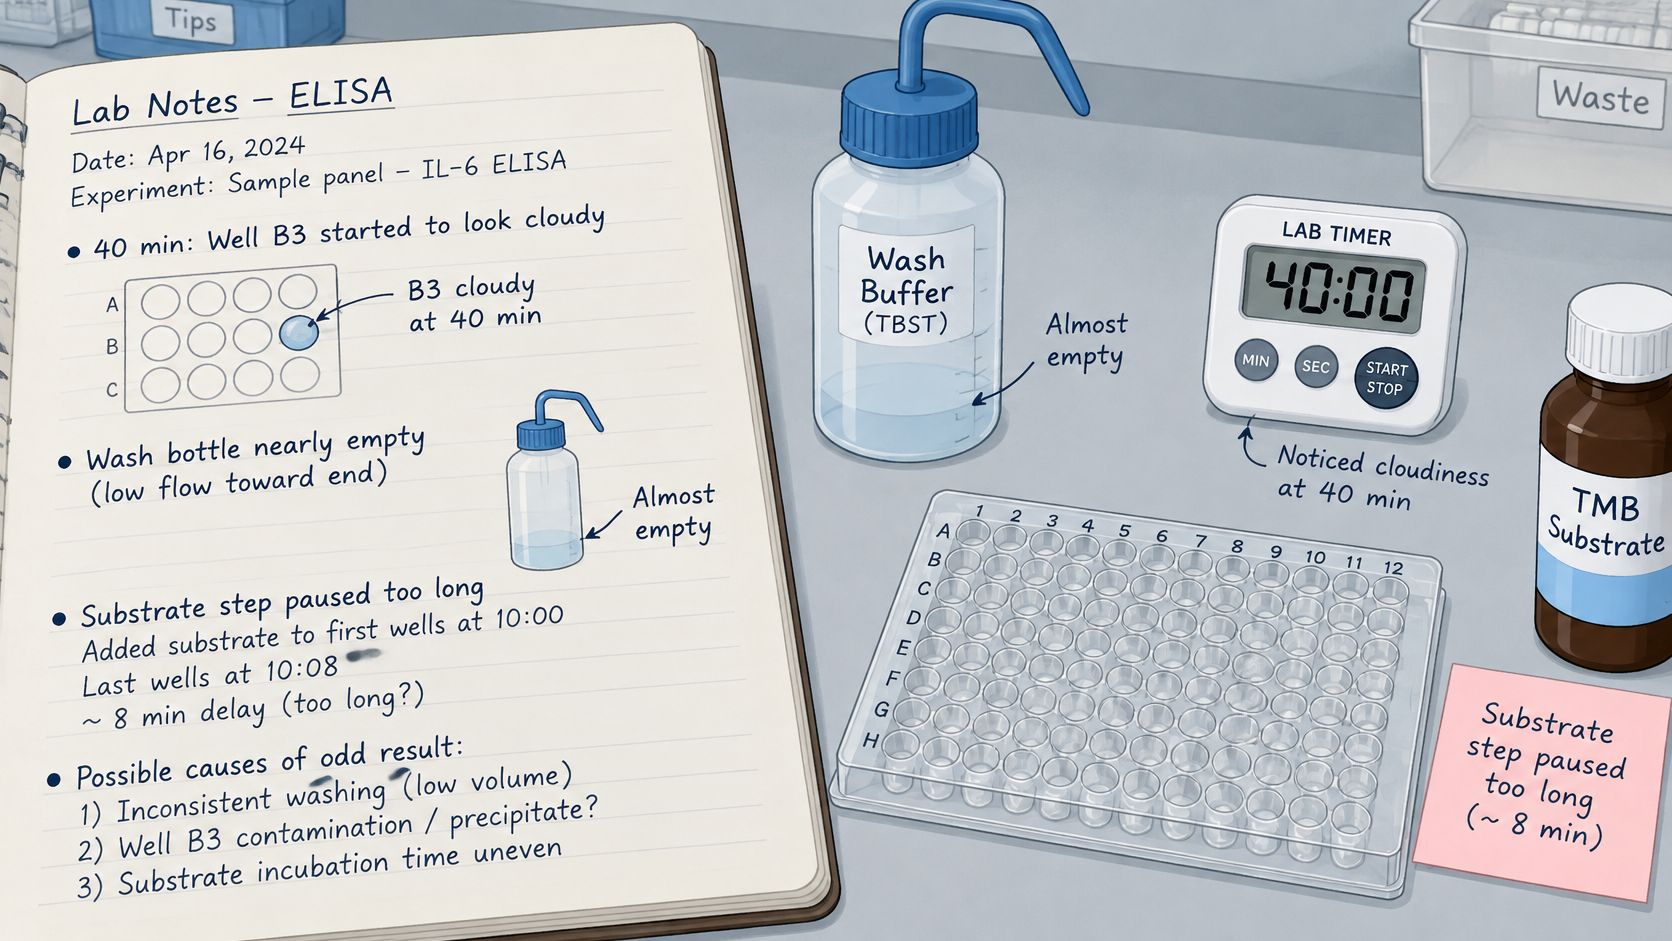
A bubble clinging to the side of well C7, a wash bottle that ran dry on the third cycle, a substrate addition that started late because the timer was still counting the previous incubation. None of these changes how the finished plate looks, yet each one can move the number it produces.
Small events like these protect the final result only when they survive long enough to be checked against it. Left on gloves, paper towels, or the margin of a printed protocol, they vanish, and a puzzling well becomes a mystery instead of a clue. Capture each event at the moment it happens: which wells it touched, what time, and what was done about it. A photograph preserves a visible change that no concentration table will show later.
A practical capture habit
- Select the context. Organize entries under Objective, Materials, Procedure, Observations, or Conclusion so each note lands where a reviewer expects to find it.
- Preserve the event. Use a voice or typed note, a timer for timed work, and an image when visual evidence matters.
- Separate observation from interpretation. "Well B4 looked cloudy" is evidence; "contamination" is a conclusion. Record the first before deciding on the second, because an interpretation can be revised while a forgotten observation cannot.
A consistent science experiment documentation practice makes this kind of review easier weeks after the run. Zemith's discussion of turning research files into accessible resources adds useful context for keeping records usable beyond the immediate experiment.
Verbex for iPhone and iPad, free to download is a private, on-device capture app for this kind of bench note, supporting voice notes, typed notes, timers, and images. Timestamped captures become a source-backed organized draft for scientist review and editing, and completed records export as PDF, Word, or to an existing ELN workflow. Processing happens on the iPhone with no account and no cloud. Verbex works alongside an ELN and leaves interpretation to the scientist, who remains responsible for meaning and decisions.
Before the next plate, place the capture record beside the plate map and log the first deviation as soon as it happens.
To keep ELISA observations, timing, and image evidence together for review and export, visit Verbal Experiment or Verbex and set up a bench-capture workflow that preserves what happened, not only what the protocol expected.